Institutional-Grade Crypto Intelligence
Smarter Market
Decisions.
Backed by Data.
TerraQuants gives funds, analysts, and active traders the live signals they need to read market structure, manage risk, and move with more conviction.
- Built for beginners
- Cancel anytime
- Built for research desks
- Built for retail investors
Why TerraQuants
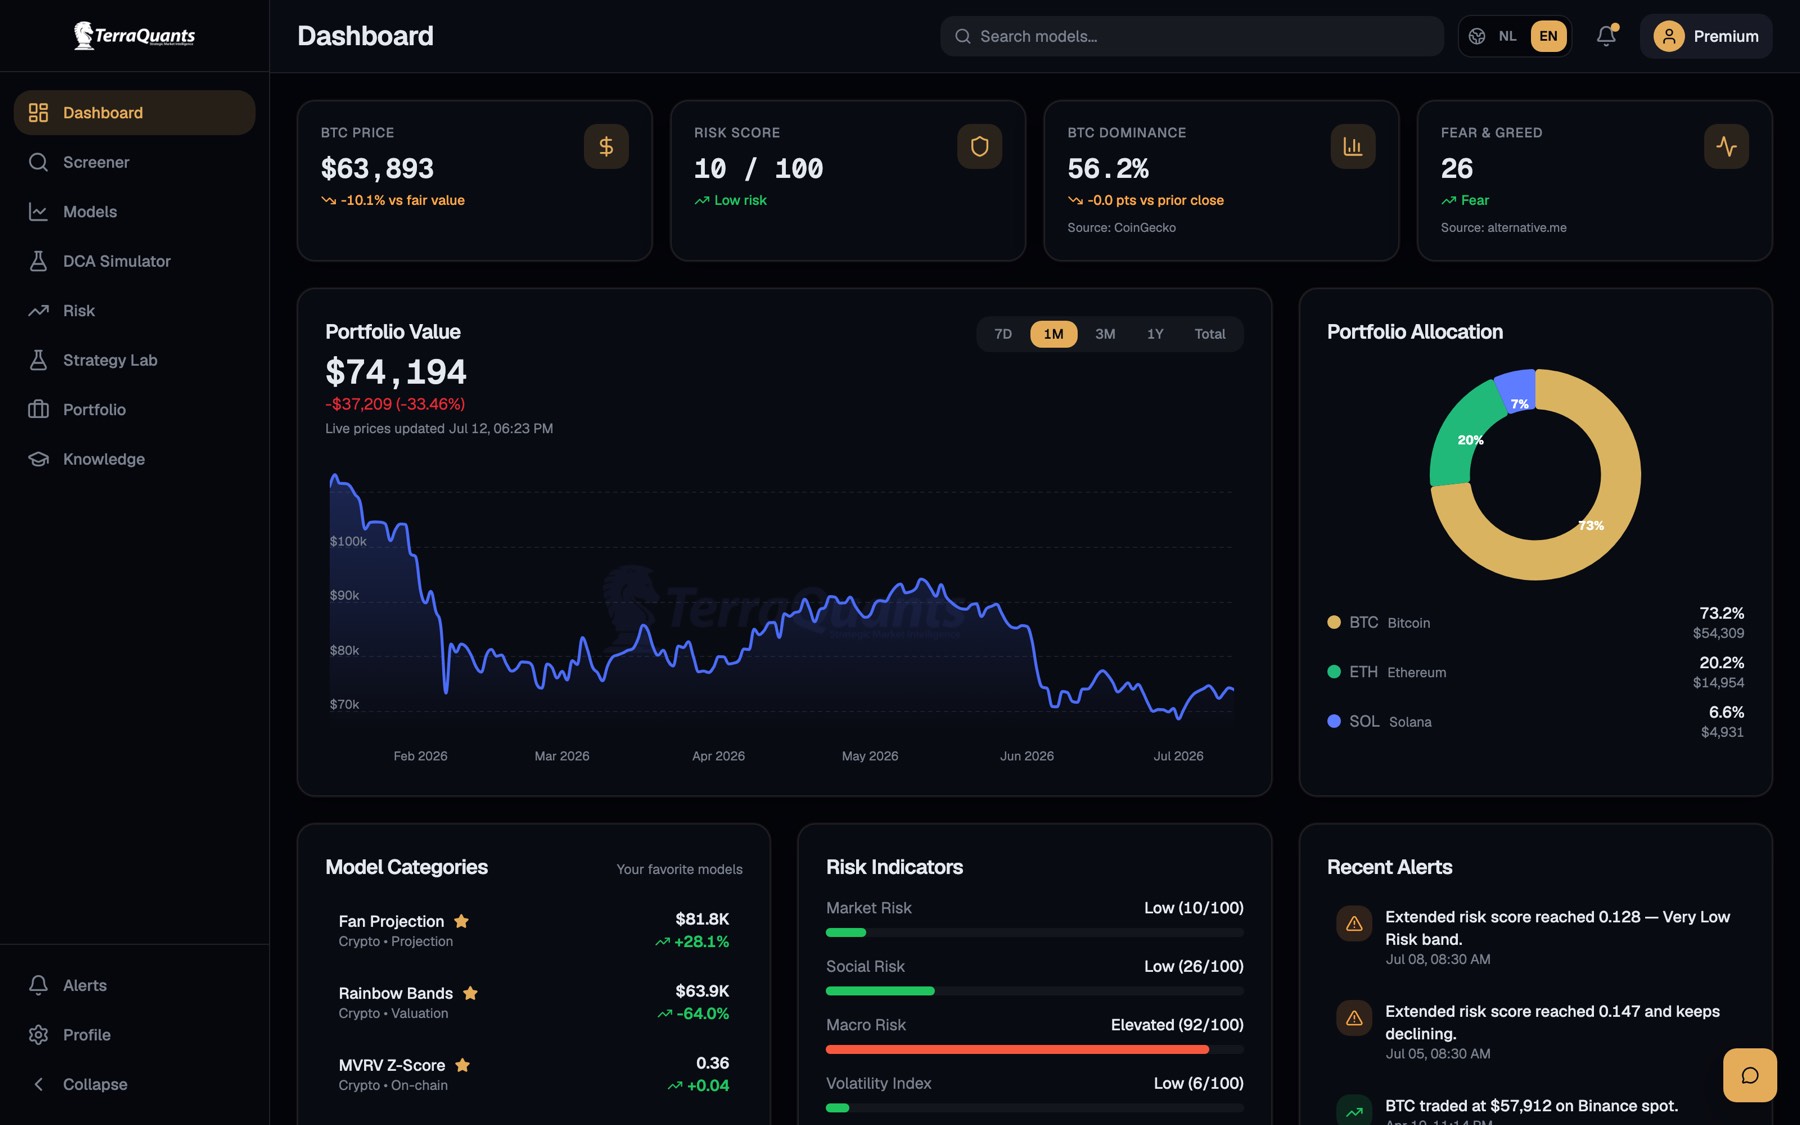
Everything you need to track crypto market structure in one view.
A premium research workspace for spotting risk shifts, confirming trends, and turning raw blockchain activity into actionable market intelligence.
On-Chain Intelligence
Track real-time wallet flows, exchange balances, and structural activity before it becomes consensus.
Advanced Charting
Layer market structure, cycle indicators, and custom overlays in a charting workflow made for fast analysis.
Risk Analysis
Use proprietary risk scores and contextual alerts to manage exposure with more confidence.
Built for Pros
Designed for traders, researchers, and institutional teams that need clarity instead of information overload.
The TerraQuants Risk Metric
One score that tells you where you are in the cycle.
Our proprietary risk model distills valuation, holder behavior, miner pressure, exchange flows, liquidity, and leverage into a single daily reading from 0 to 1 — with a clear recommendation for every level.
Daily score since 2011
6 on-chain components
10 risk bands with playbooks
Ten bands, grounded in fourteen years of history.
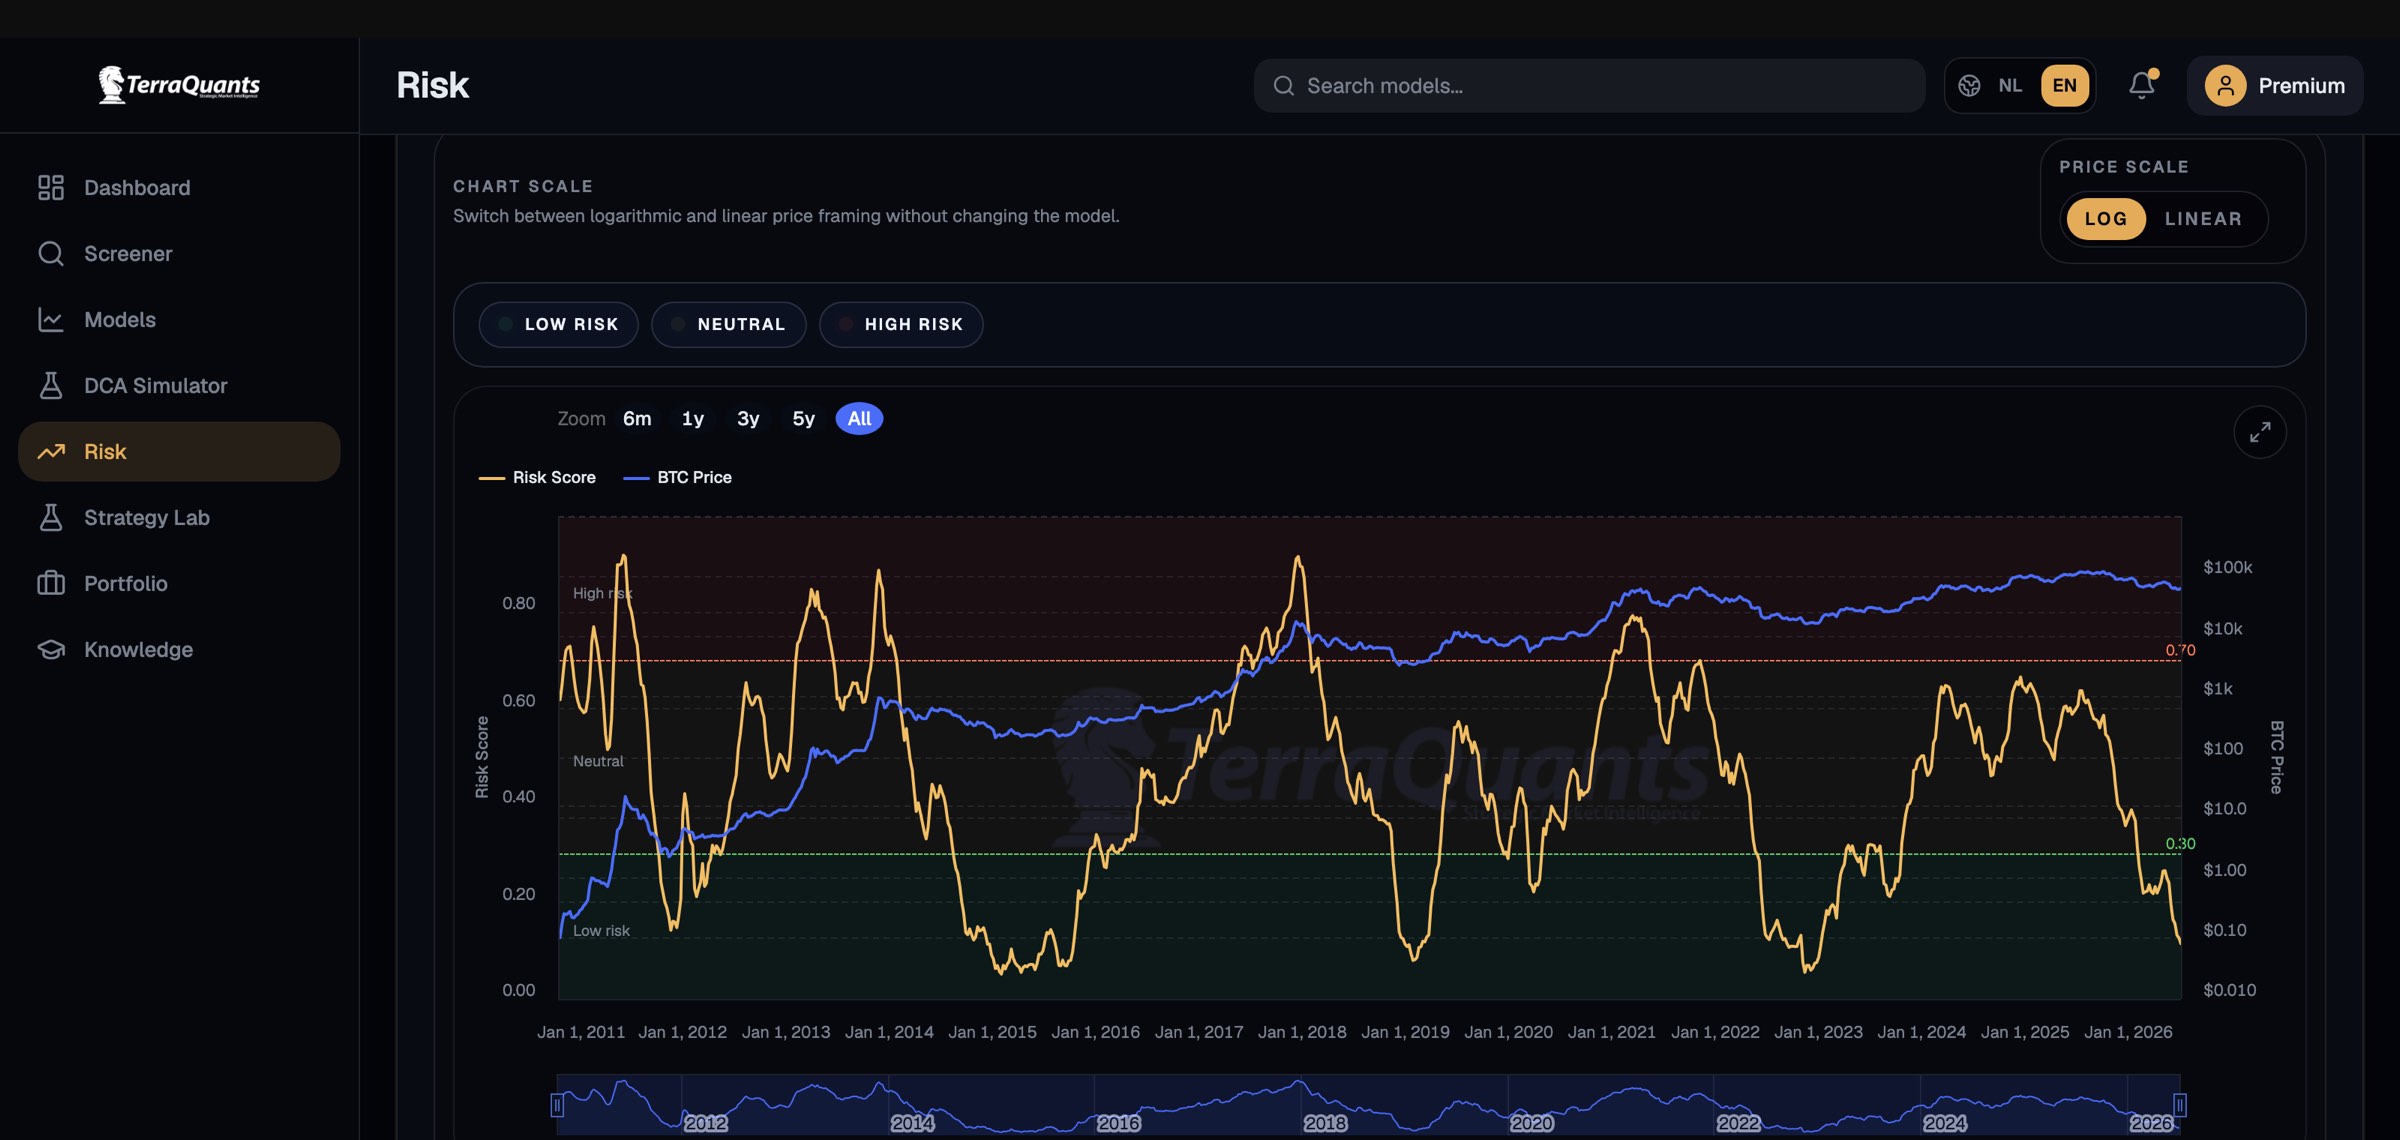
The score maps to ten risk bands, from Extreme Low to Maximum Risk. The distribution shows how rare the extremes really are — and why the model treats them as its strongest signals.
- Time spent in every band since 2011
- Current band highlighted in the app in real time
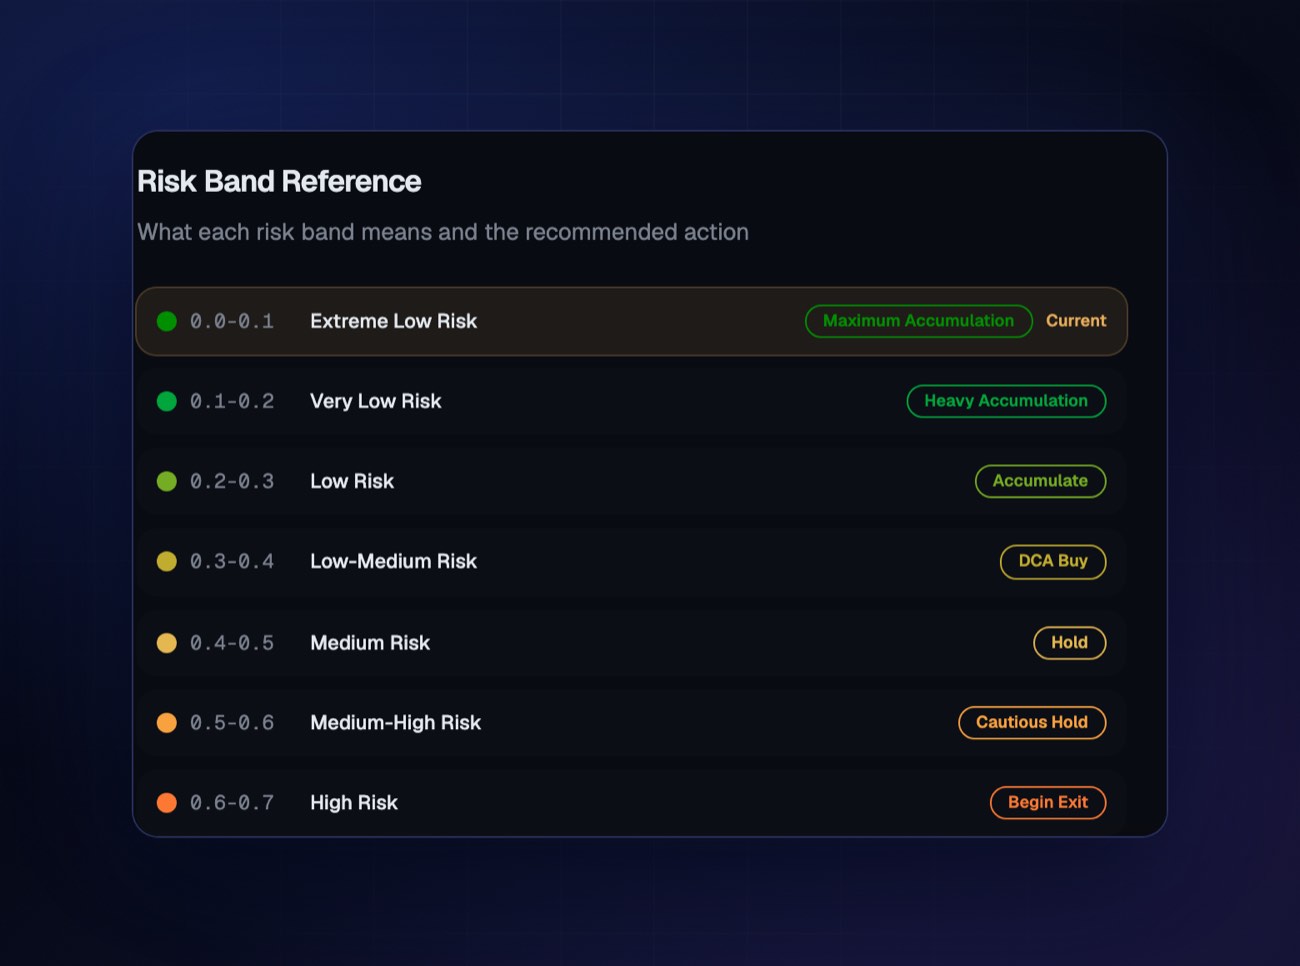
- Each band pairs with an action — from Maximum Accumulation to Scale Out
Full history
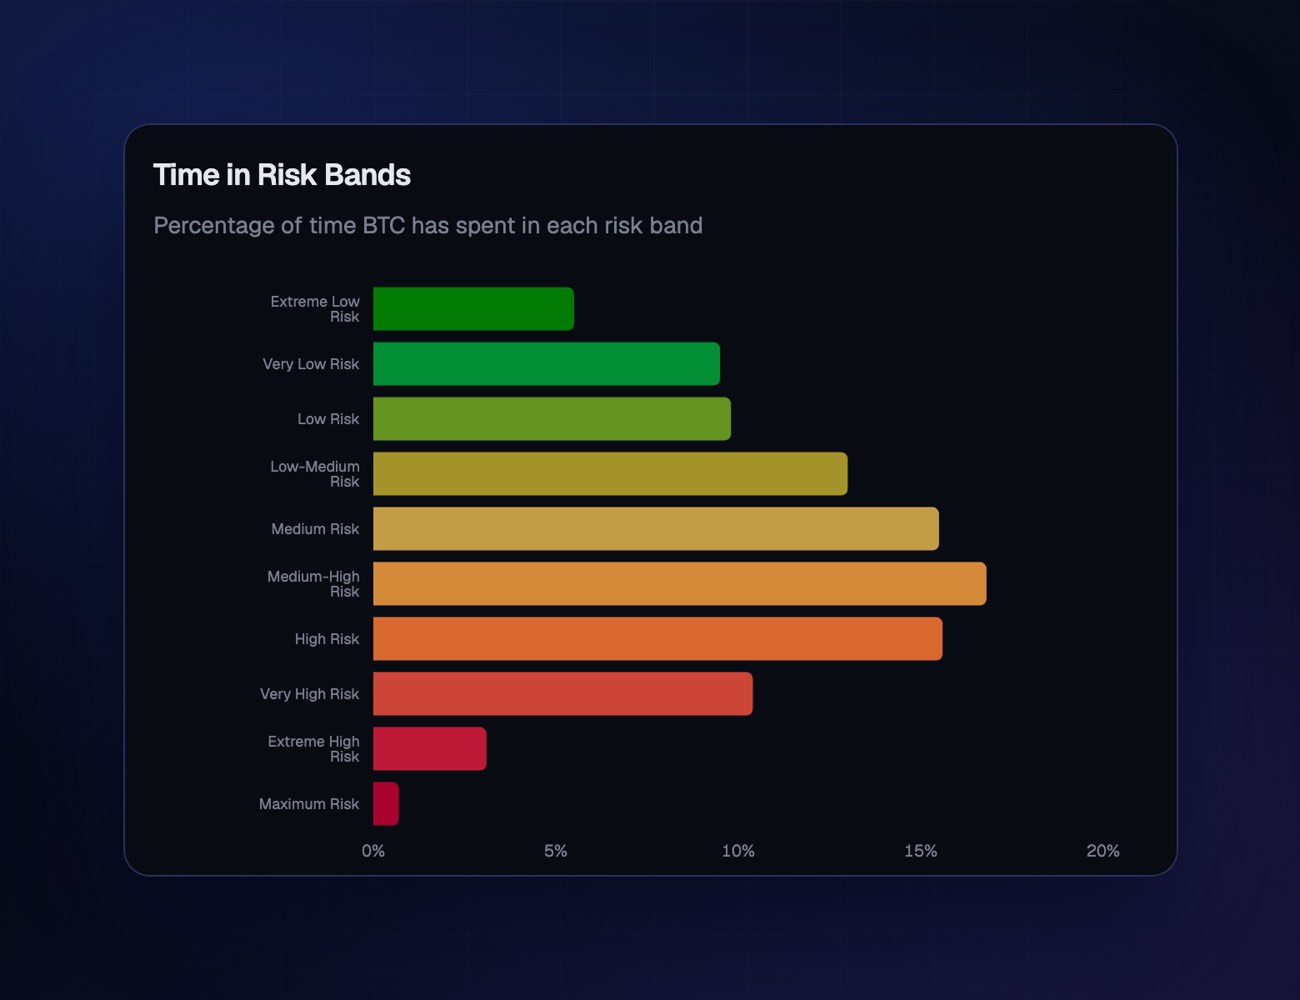
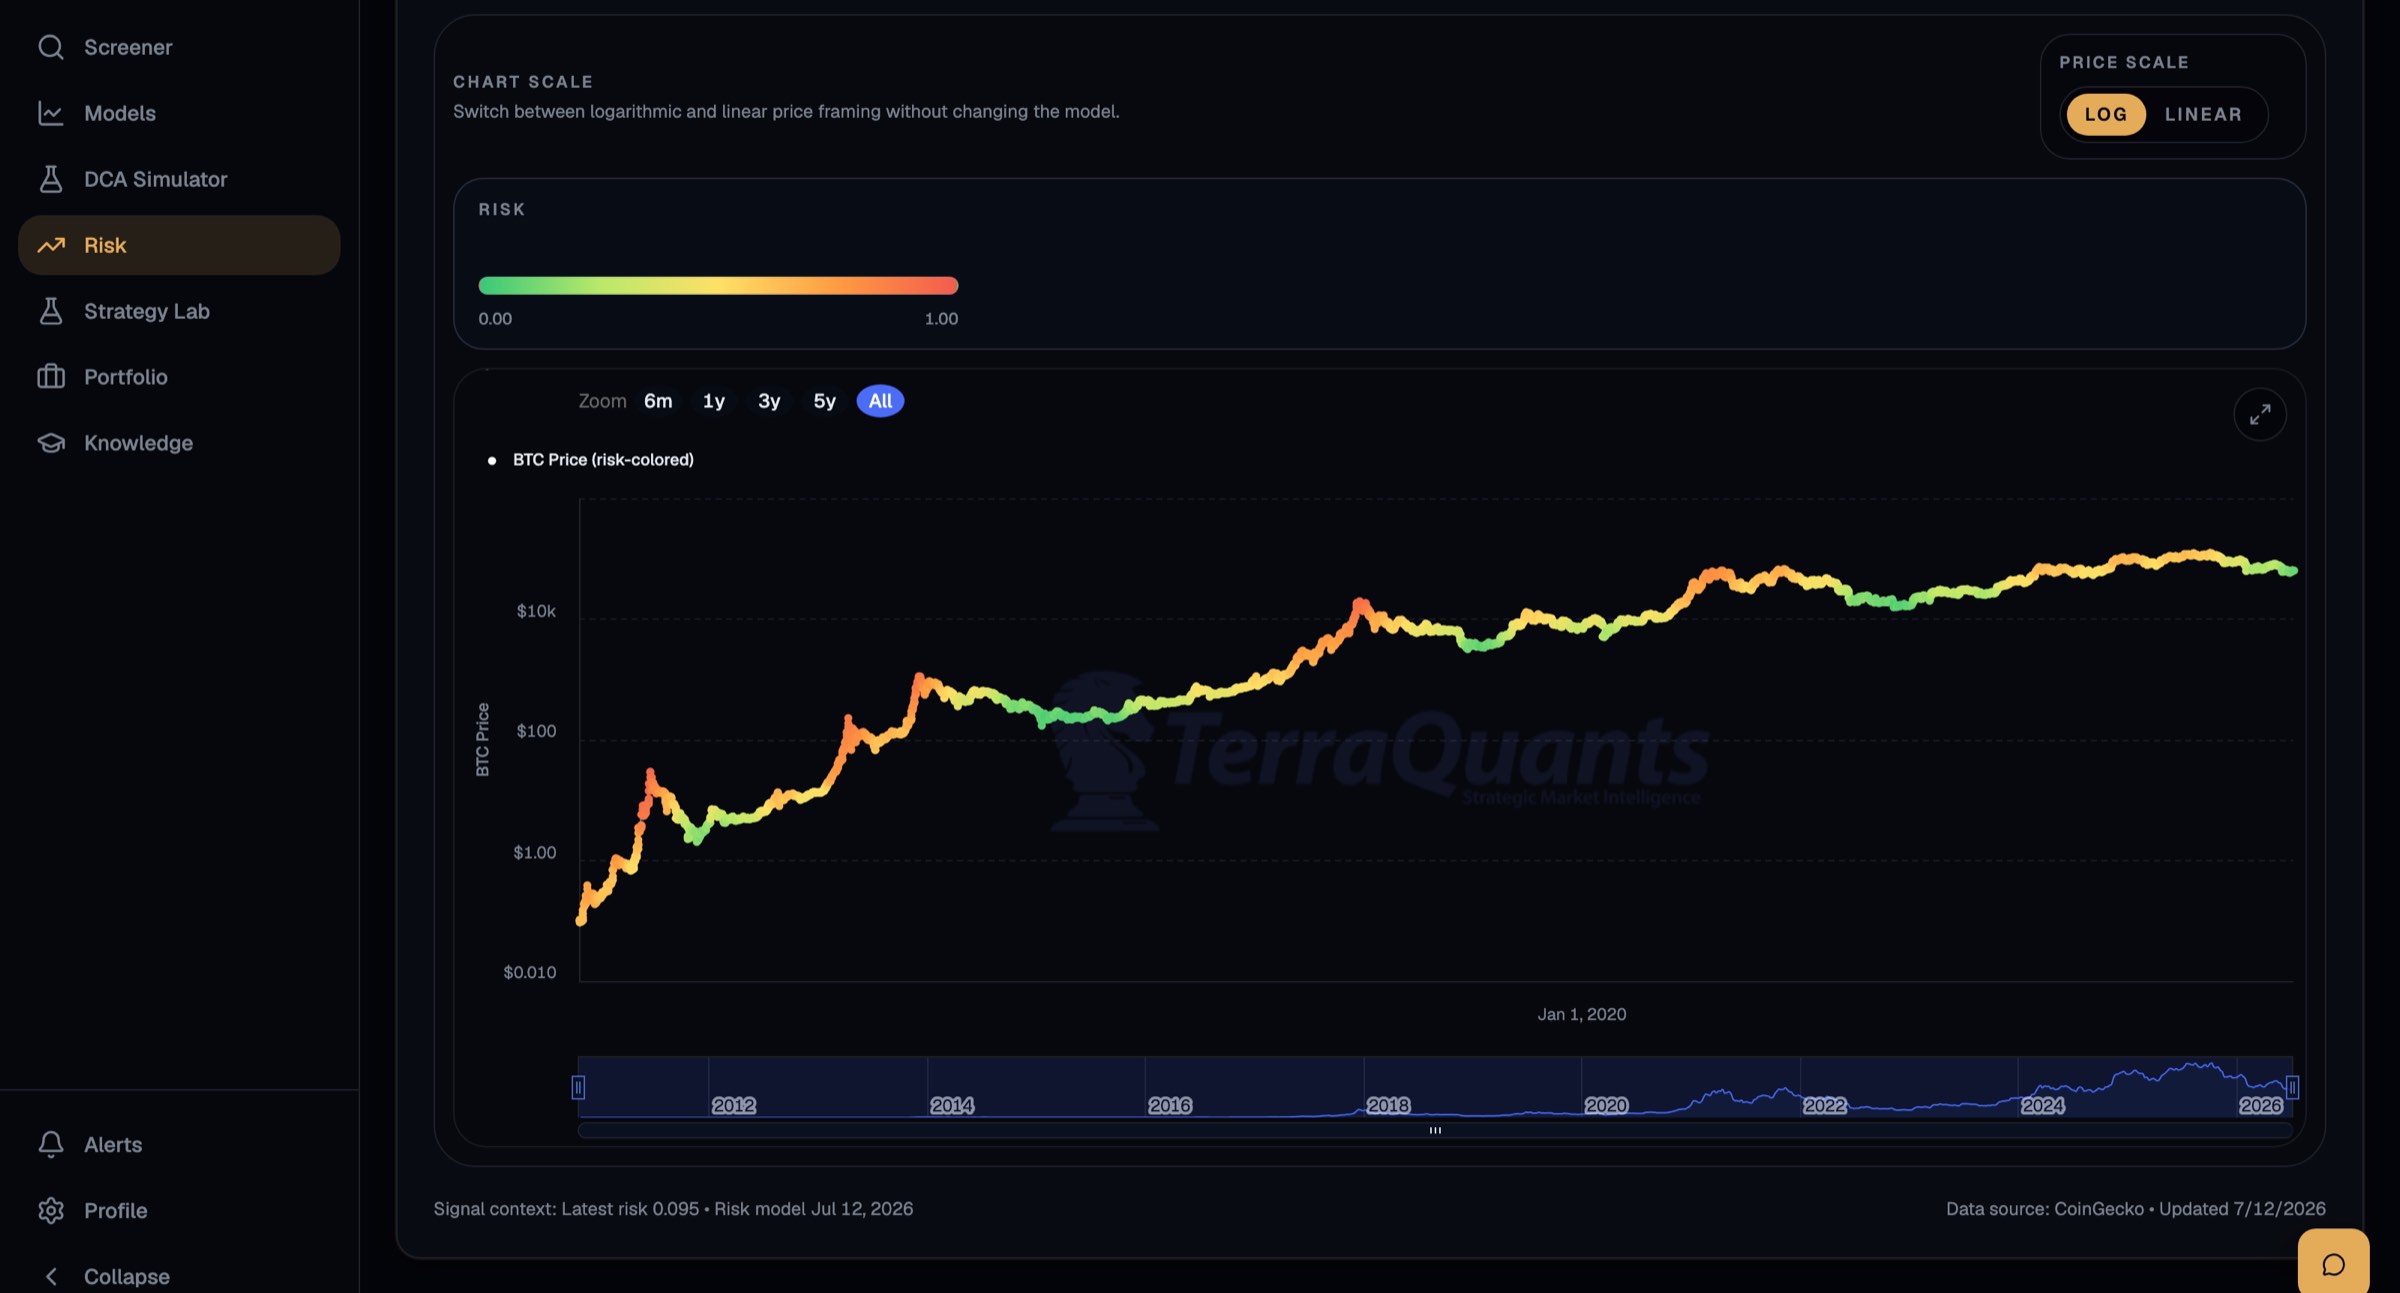
Fourteen years of Bitcoin, colored by one score.
The same score, painted across every daily close since 2011 — so you see in one glance where accumulation ends and distribution begins.
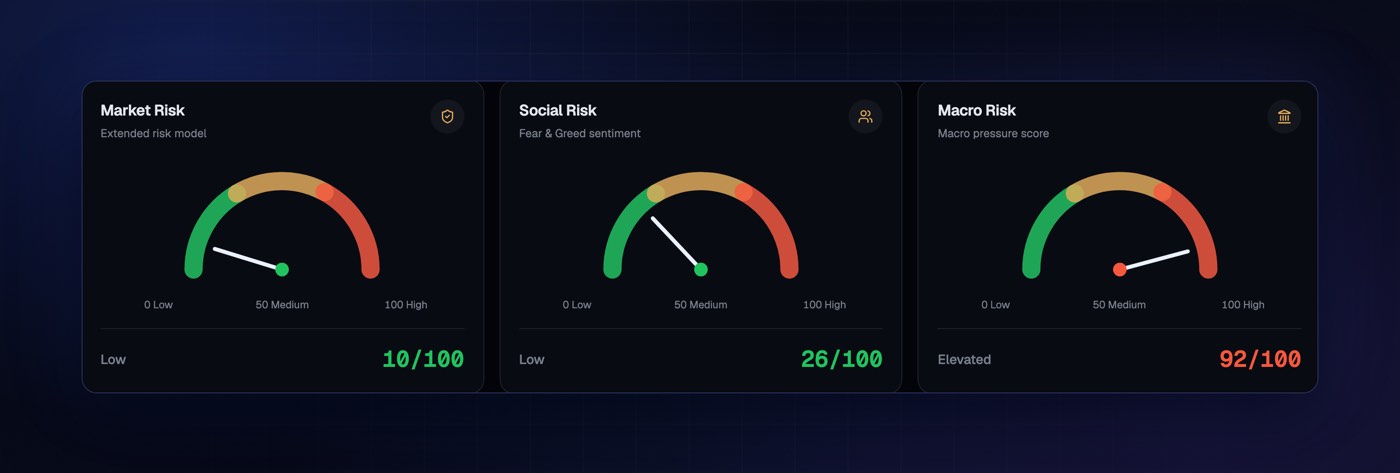
Three dimensions, read separately.
Market, social, and macro pressure each get their own gauge — so you know whether risk is coming from the chain, the crowd, or the Fed.
- Extended risk model with on-chain components
- Fear & Greed sentiment, tracked live
- Macro pressure score across credit, growth, and inflation
Built to act on
From reading the market to executing a plan.
Every chart on TerraQuants feeds a workflow: simulate a strategy, stress-test the horizon, track the portfolio, and get alerted the moment conditions change.
DCA Simulator · Pro & Premium
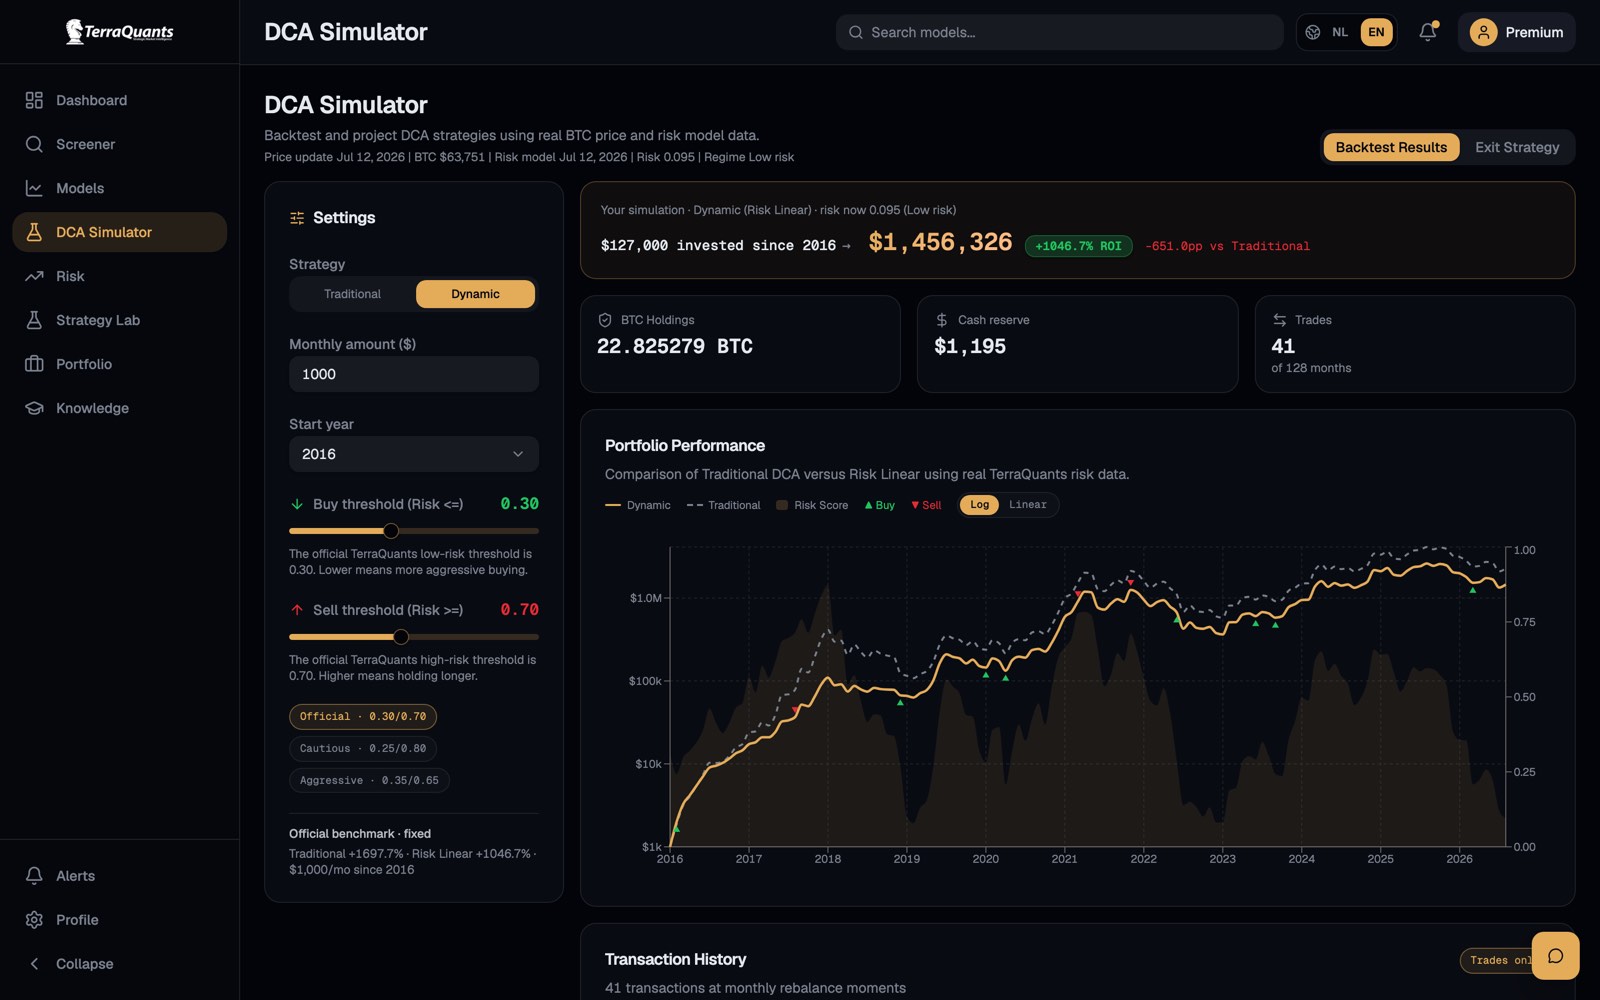
Backtest risk-driven buying against classic DCA.
Simulate a monthly plan on real BTC prices and the live risk model — then compare Dynamic buying and selling against the traditional baseline, trade by trade.
- 128-month backtests on real model data
- Buy and sell markers at every risk threshold
- Official, cautious, and aggressive presets
Strategy Lab · Premium
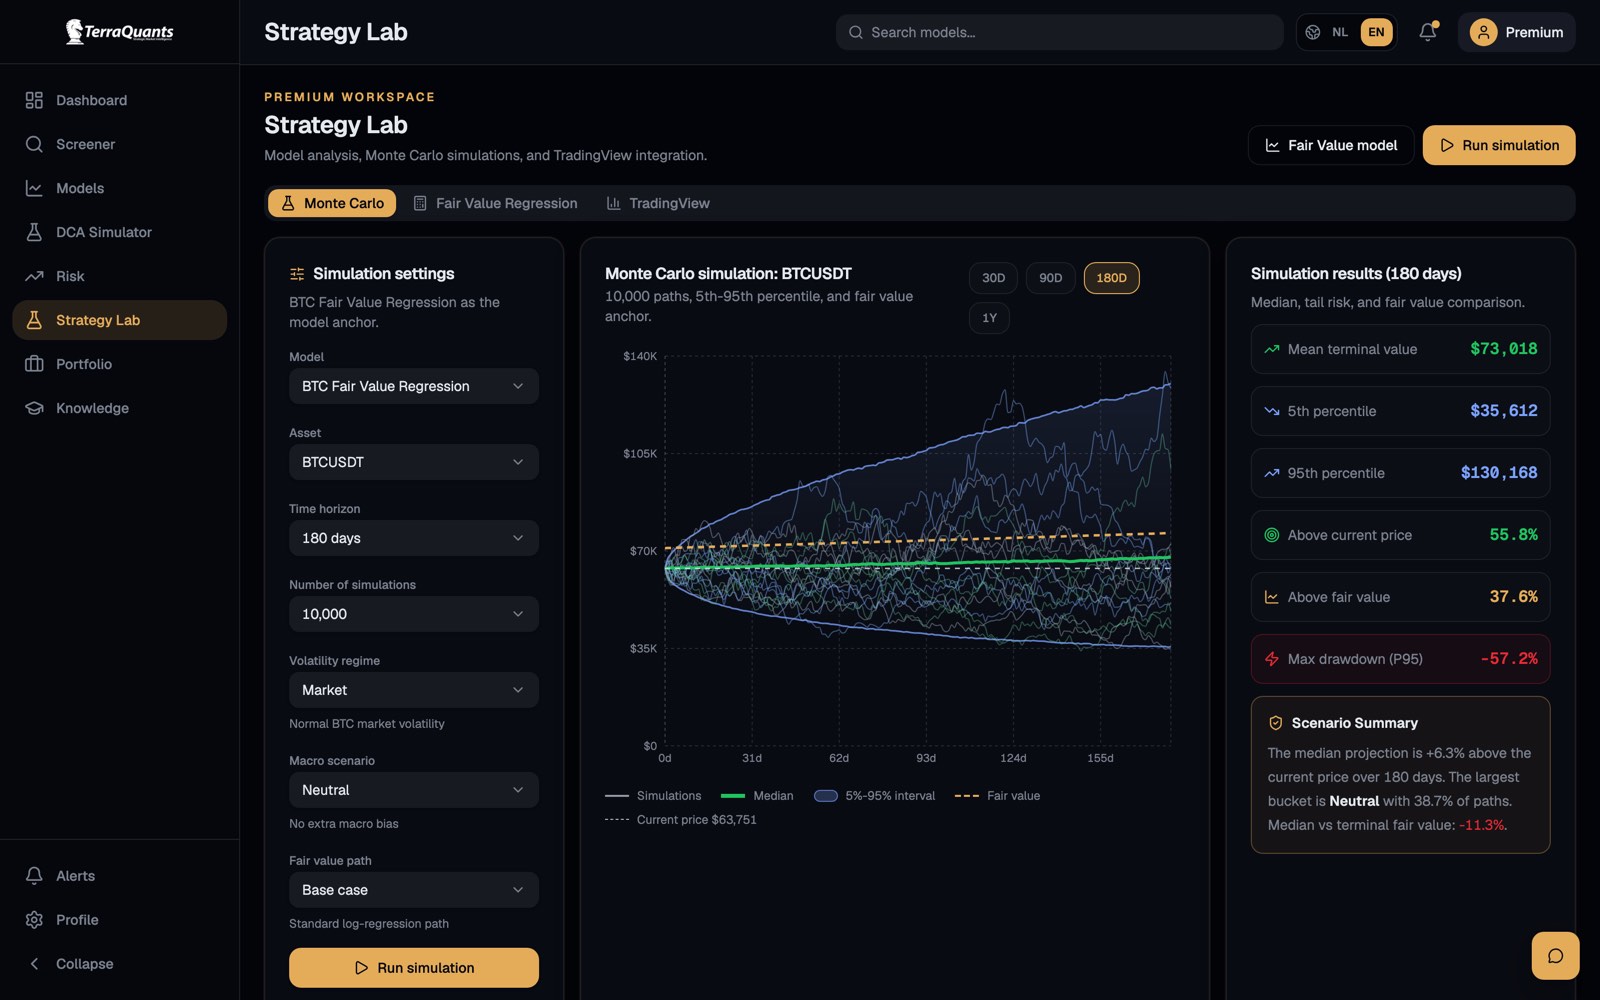
Stress-test the next 180 days with 10,000 Monte Carlo paths.
Simulations anchored to the Fair Value regression show percentile envelopes, drawdown tails, and the odds of ending above today's price — in plain language.
- 5th–95th percentile projection envelopes
- Scenario summary with fair-value comparison
- Fair Value regression and TradingView tabs
Portfolio Intelligence
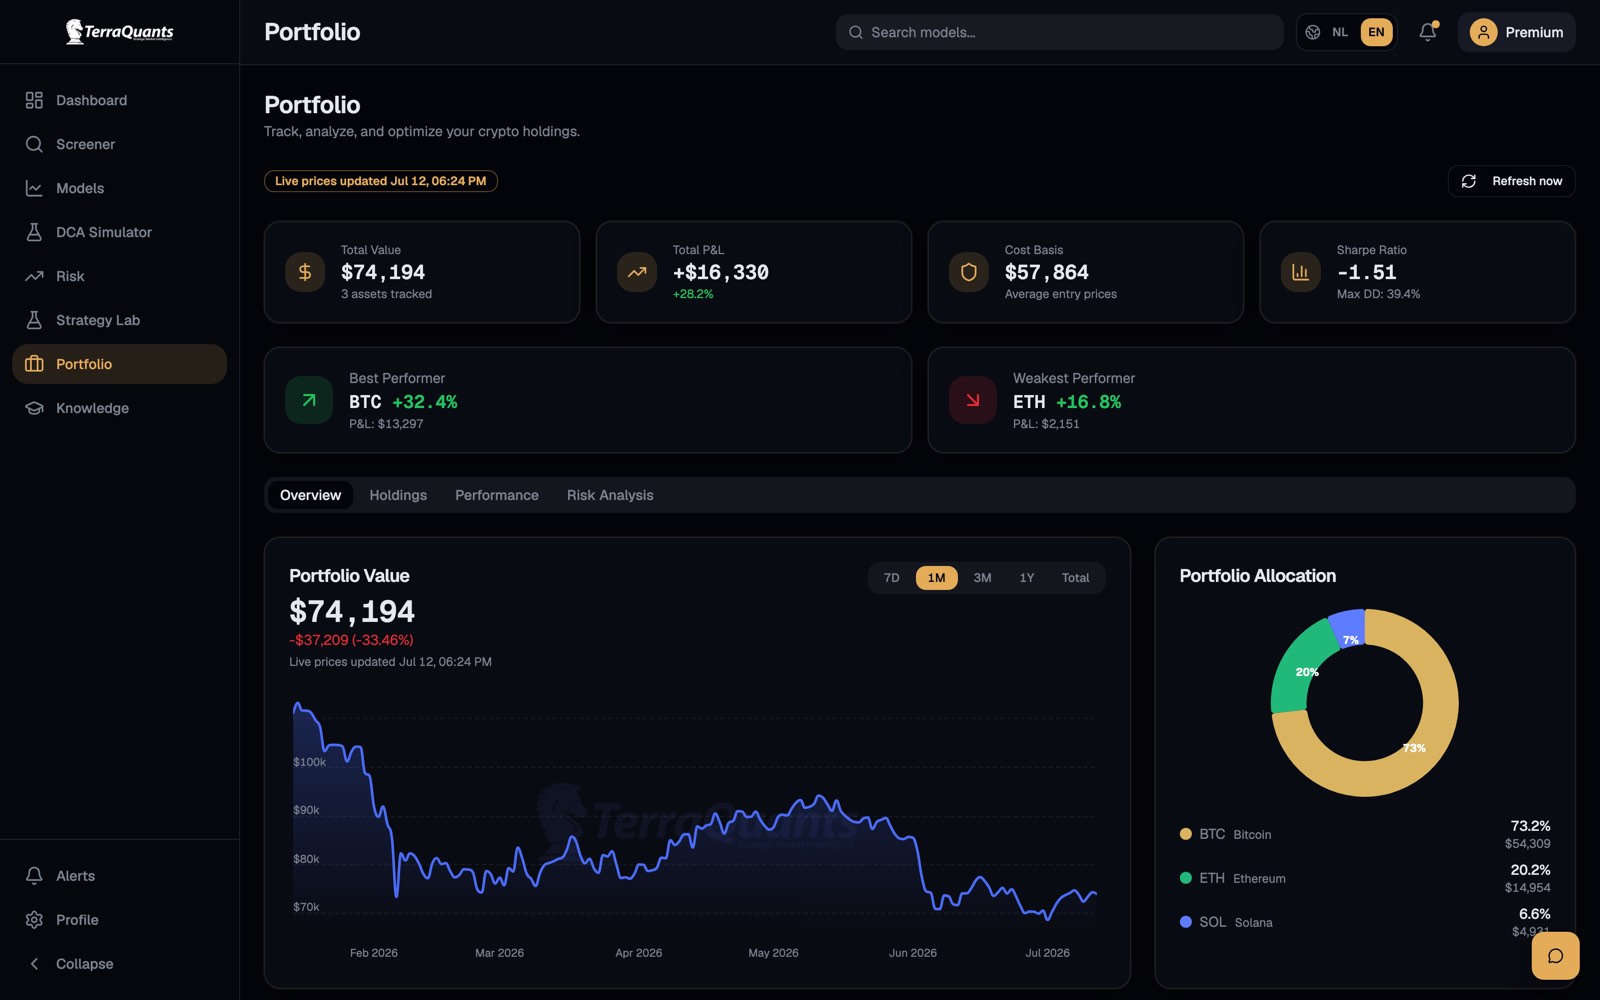
Monitor value, allocation, and top movers from a single command center.
See live portfolio value, attribution, allocation mix, and strongest or weakest positions without jumping between trackers or spreadsheets.
- Live valuation and P&L context
- Allocation breakdowns for key holdings
- Sharpe, drawdown, and concentration metrics
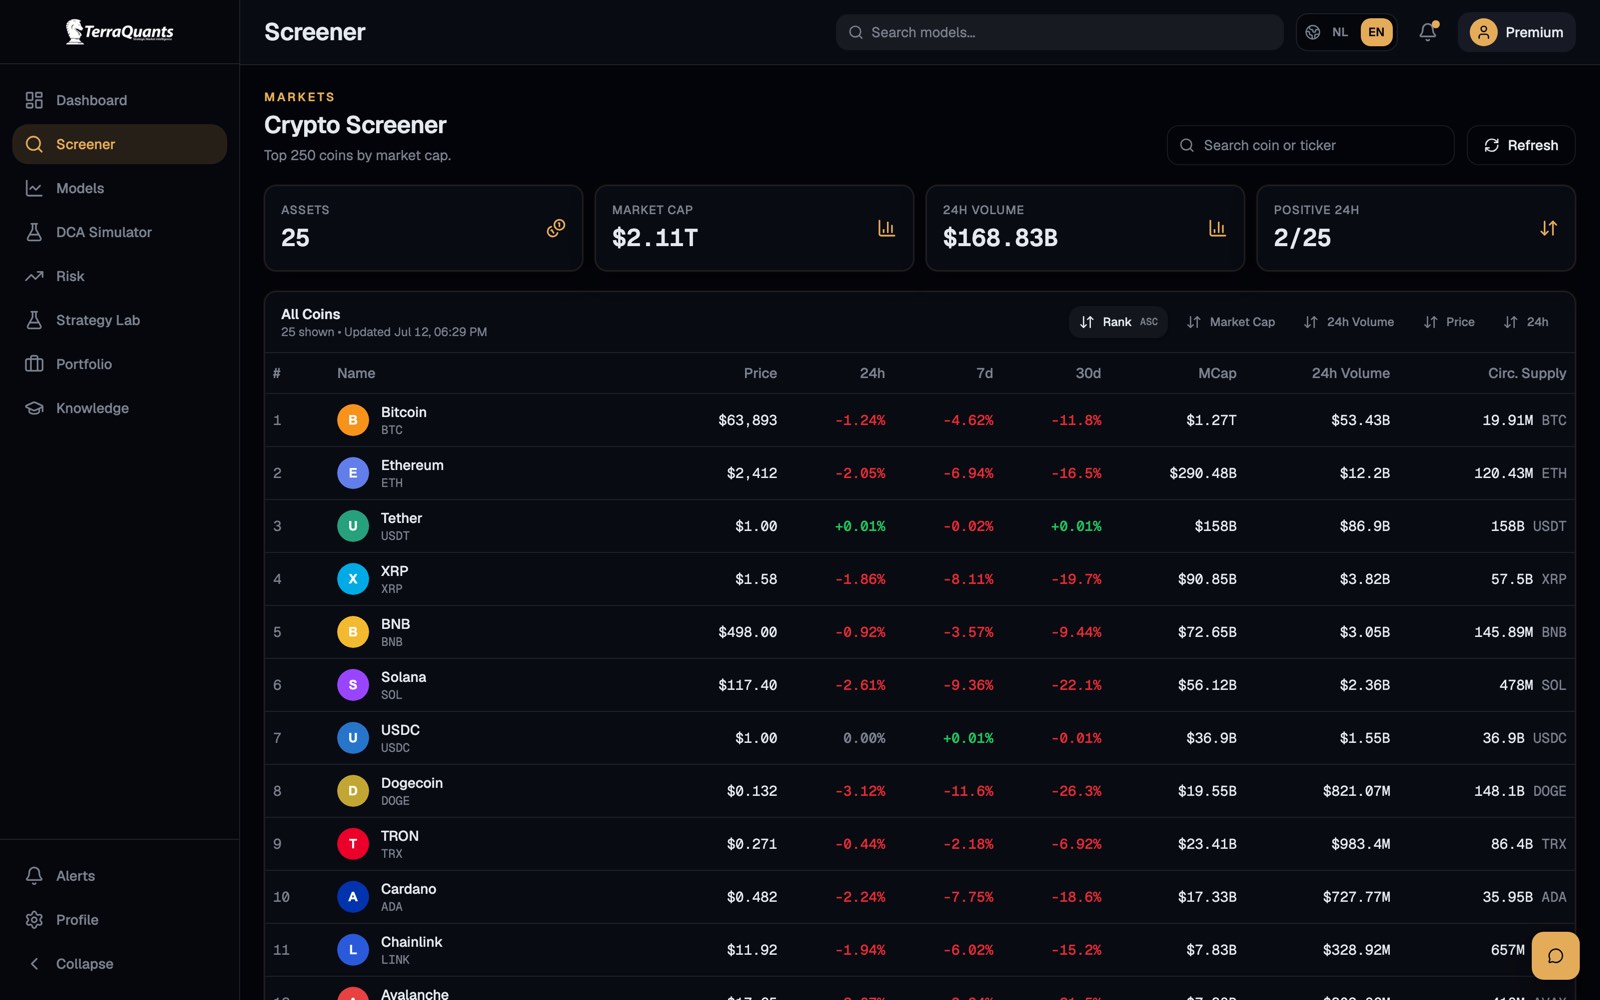
Markets · Screener
The whole market in one sortable table.
Price, momentum across three horizons, market cap, volume, and supply for the top coins — with sparklines that show the week at a glance.
- Top 250 coins by market cap
- 24h, 7d, and 30d momentum side by side
- One-click refresh with live data
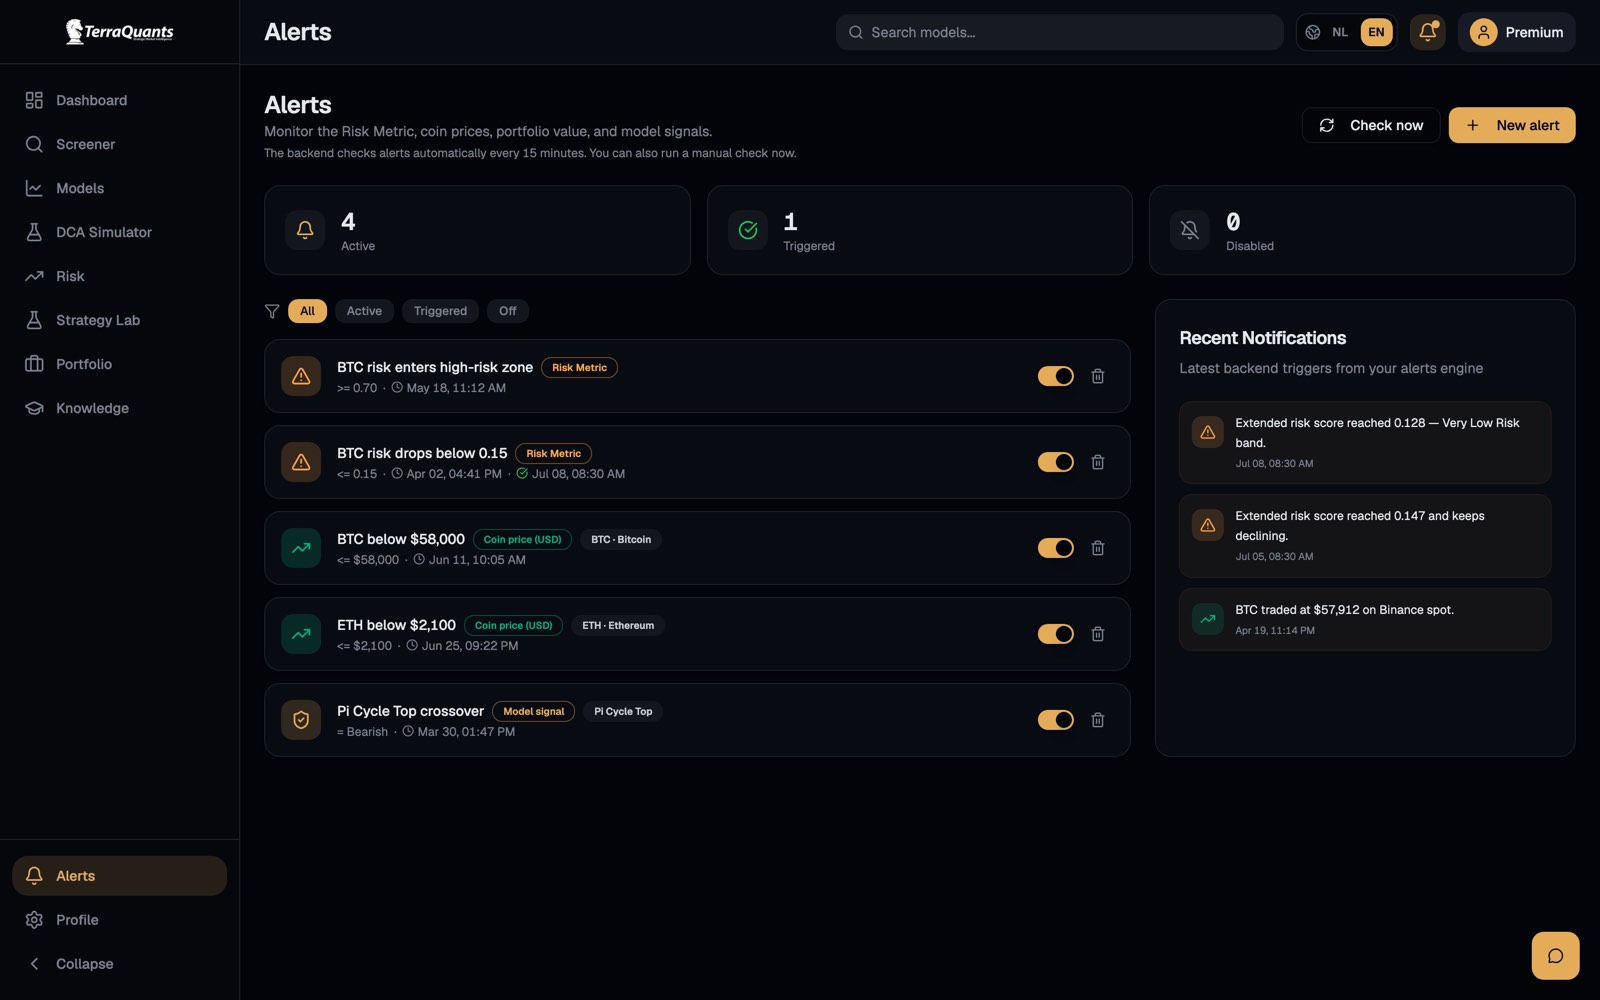
Alerts that watch the model, not just the price.
Rules on the risk score, coin prices, portfolio value, and model signals — checked every 15 minutes, delivered by email and push.
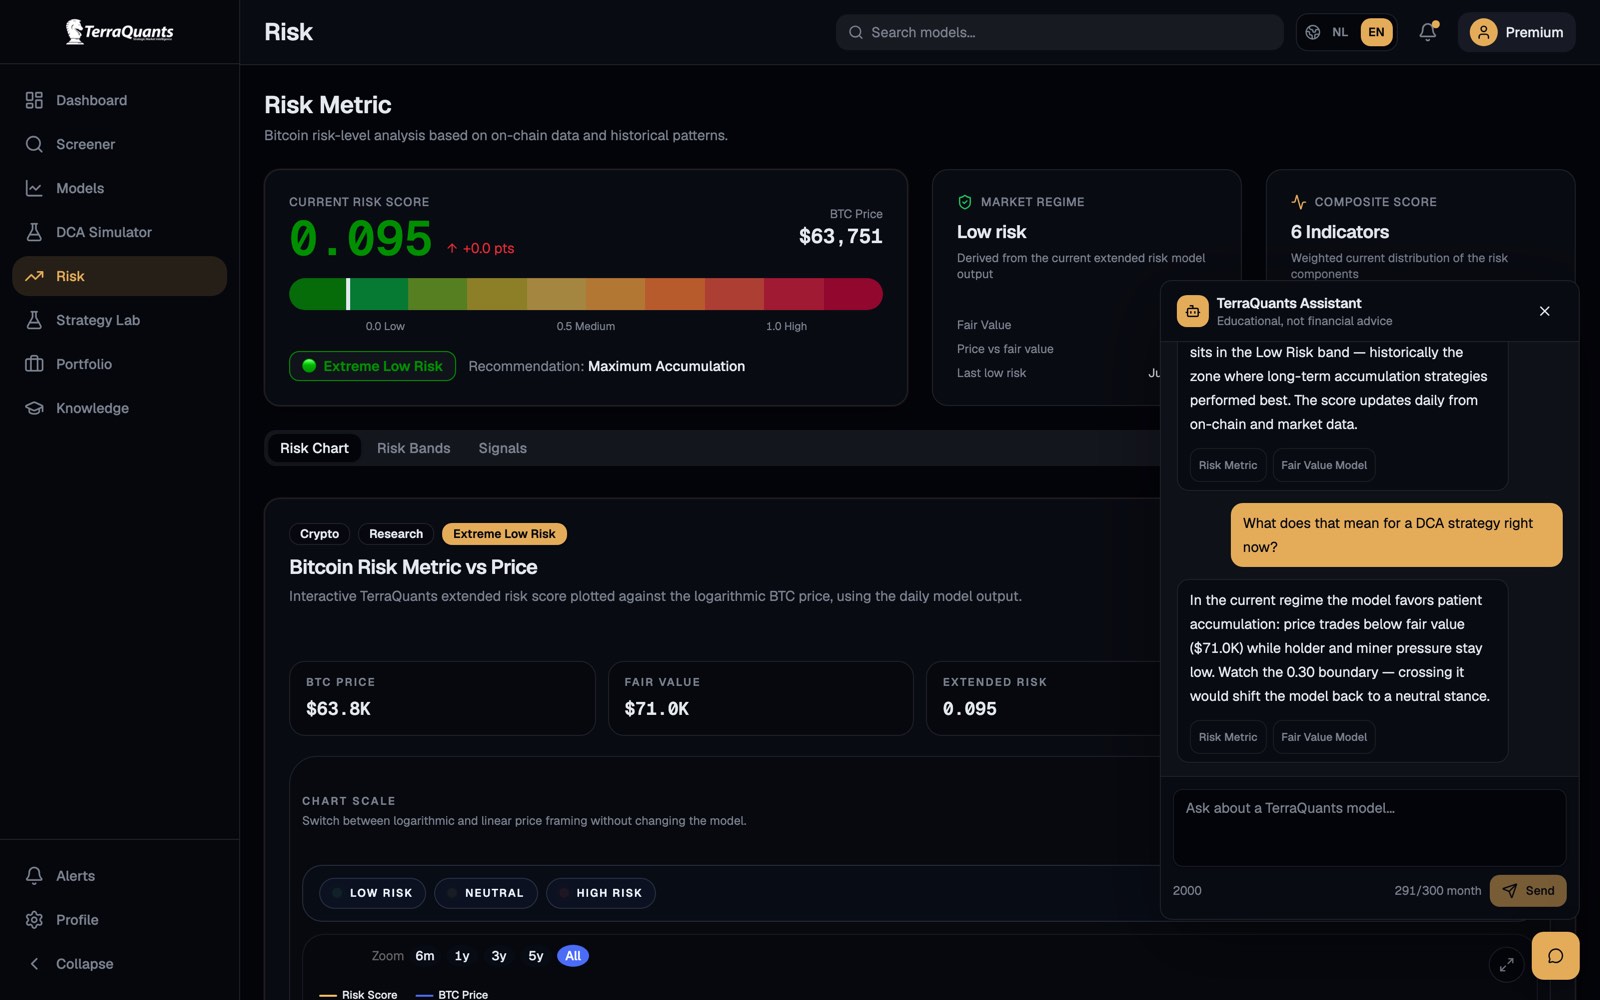
An assistant that knows every model.
Ask why the score moved and get an educational answer with sources — grounded in the same data you see on screen.
Research Workflow
1. Detect structural shifts
2. Validate with chart context
3. Share the read instantly
From signal to conviction without switching between tools.
TerraQuants combines market dashboards, signal scoring, and contextual notes in one research surface, so your team can move from observation to action faster.
Monitor liquidity flows, exchange activity, and cycle risk at a glance.
Layer technical structure and historical analogs before entering or de-risking.
Create consistent workflows for desks, clients, and research partners.
Risk Band Reference
What each risk band means — and the recommended action.
Pricing
Launch offer
Three plans designed to match how deep you want to go with TerraQuants.
Start with the essentials for free, move into deeper analysis with Pro, or unlock the full institutional-grade workflow with Premium. To celebrate our launch, Pro and Premium are temporarily available at introductory prices.

Free
Explore TerraQuants with essential features.
€0
/ month
- Dashboard overview
- A selection of top models from every category
- Risk model preview (up to 2 years back)
- Community support

Pro
For serious crypto investors and active researchers.
€29.99
/ month
Limited-time launch price
- Everything in Free
- All model categories
- Historical risk chart and bands analysis
- DCA simulator (classic strategy)
- Portfolio tracking and analysis
- Email and push alerts (up to 10 rules)
- Priority support

Premium
Maximum insight, advanced tooling, and exclusive access.
€49.99
/ month
Limited-time launch price
- Everything in Pro
- Dynamic DCA: risk-driven buying and selling
- Full on-chain signal components
- Color-coded price risk chart
- Strategy Lab access
- Unlimited alerts
- 3x assistant limit
Secure checkout via Stripe. Cancel anytime from your account.
Roadmap
From a strong crypto foundation to broader multi-asset research.
We are deepening the complete crypto research workflow first: reliable data, understandable models, portfolio analysis, and useful alerts. We will then apply the same framework carefully to ETFs, equities, real estate, and forex.
-
Platform v1.0
Risk Metric, 150+ crypto and macro models, top-250 screener, portfolio analysis, alerts, Strategy Lab, and 2FA.
-
Expanded research toolkit
Interactive charting, 28 on-chain models, DCA cockpit, efficient frontier, Altcoin Season Index, and an educational AI assistant.
-
Private beta
A selected tester group helped us refine onboarding, model clarity, mobile workflows, alerts, and portfolio analysis ahead of launch.
-
Public launch
Self-serve registration is live: create a free account and upgrade to Pro or Premium through secure Stripe checkout whenever you are ready.
-
Portfolio imports & alert delivery
CSV portfolio imports, research into secure read-only exchange connections, and the groundwork for browser notifications.
-
Crypto capital flows
Spot ETF flows and holdings, dashboards for listed bitcoin treasury companies, and research into asset-specific risk models after data and methodology validation.
-
TerraQuants Equity
A validated extension to equities: index risk models, valuation dashboards, and an equity screener, subject to reliable data and licensing.
-
TerraQuants Real Estate
Research into cycle and valuation models for housing markets, interest rates, affordability, and REITs, built only on reviewed public or licensed data.
-
TerraQuants Forex
Exploring currency markets within the same framework: the dollar index, rate differentials, and macro models for major currency pairs.
Statuses reflect our current priorities. Quarters from Q4 2026 onward are indicative, not delivery guarantees — order and timing may shift based on user feedback, data quality, licensing, and market conditions.
Email Updates
Get TerraQuants market intelligence in your inbox.
Subscribe for product updates, curated market notes, and signal-driven research drops from TerraQuants without cluttering your inbox.
- Weekly market commentary
- New indicator and platform updates
- Institutional-grade research highlights